Fish and Seafood as Protein Sources: Nutritional Profiles
Fish and other aquatic organisms represent protein sources with distinctive nutritional characteristics, particularly omega-3 polyunsaturated fatty acids. Marine protein sources demonstrate complete amino acid profiles with DIAAS scores indicating high digestibility and bioavailability.
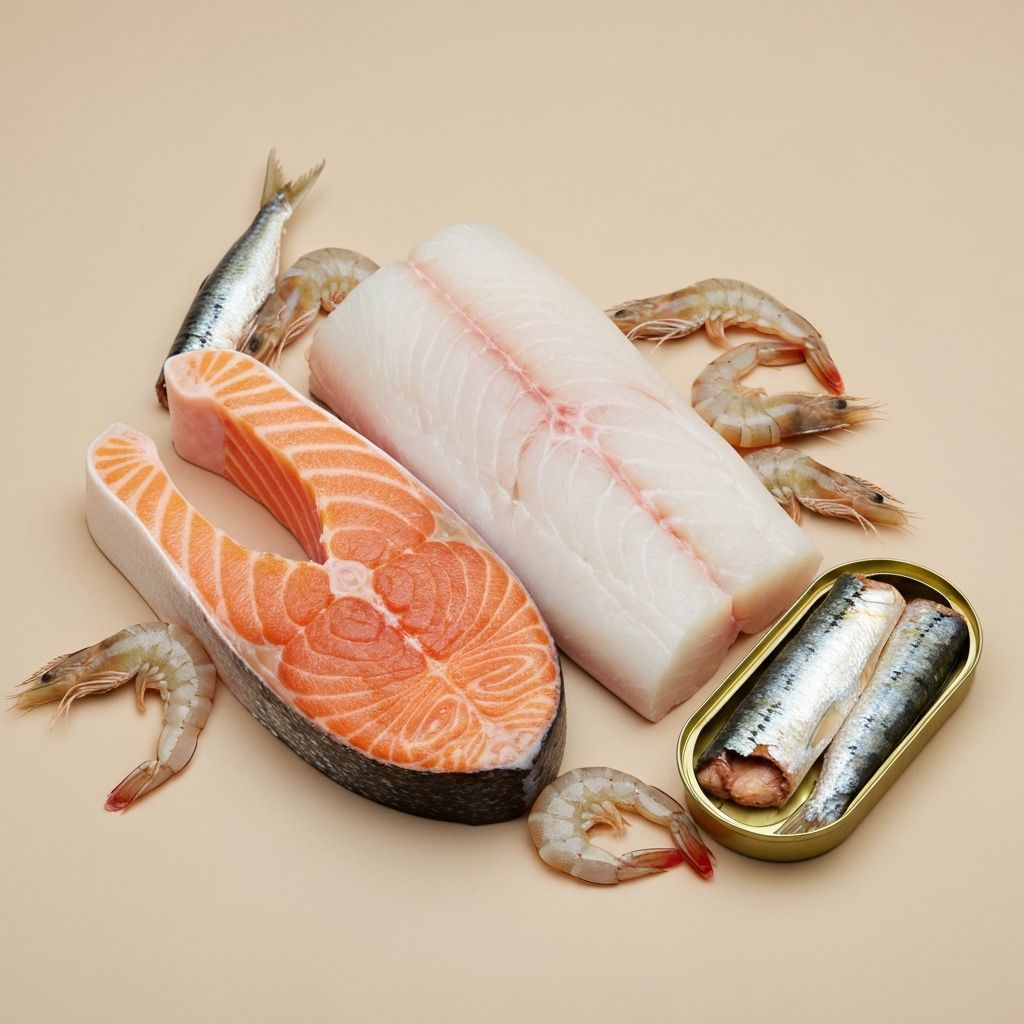
Fatty Fish Protein and Lipid Content
Salmon exemplifies fatty fish containing approximately 25 grams of protein per 100 grams alongside elevated lipid concentration from 13 to 21 grams depending on preparation and fish age. The lipid profile in fatty fish emphasizes long-chain omega-3 polyunsaturated fatty acids (EPA and DHA), which distinguish marine protein sources from terrestrial animal proteins. These lipids support cardiovascular, neurological, and immune function through multiple physiological mechanisms distinct from protein contribution alone.
| Fatty Fish Type | Protein (g/100g) | Omega-3 (g/100g) | DIAAS Score |
|---|---|---|---|
| Salmon (cooked) | 25 | 2.3 | 1.0 |
| Mackerel (cooked) | 23 | 2.2 | 0.98 |
| Sardines (canned) | 25 | 1.5 | 0.99 |
| Herring (cooked) | 20 | 1.7 | 0.97 |
White Fish Protein Characteristics
White fish species including cod, haddock, and halibut provide lean protein sources with substantially lower lipid content compared to fatty fish. These species deliver 18 to 24 grams of protein per 100 grams with fat content below 2 grams per 100 grams. White fish demonstrates complete amino acid profiles with DIAAS scores at or near 1.0, indicating digestibility equivalent to reference standards. The reduced lipid concentration in white fish renders these sources appropriate for dietary patterns emphasizing minimal fat consumption while maintaining adequate protein intake.
| White Fish Type | Protein (g/100g) | Fat (g/100g) | DIAAS Score |
|---|---|---|---|
| Cod (cooked) | 20 | 0.7 | 1.0 |
| Haddock (cooked) | 19 | 0.7 | 0.99 |
| Halibut (cooked) | 23 | 1.4 | 1.0 |
| Tilapia (cooked) | 26 | 1.7 | 0.98 |
Shellfish as Protein Sources
Molluscs and crustaceans provide protein with distinctive micronutrient profiles. Shrimp contains 24 grams of protein per 100 grams with minimal fat. Clams deliver 12 grams of protein per 100 grams alongside exceptional iron content exceeding 28 milligrams per 100 grams. Oysters provide complete protein with 8 grams per 100 grams alongside zinc concentration reaching 16 milligrams per 100 grams. These micronutrient densities distinguish shellfish nutritional profiles despite lower absolute protein concentration compared to finfish.
Amino Acid Profiles and Digestibility
Fish and seafood demonstrate complete amino acid profiles with DIAAS scores approaching 1.0 across categories. Particularly concentrated amino acids include taurine (elevated in shellfish and certain finfish), arginine, and branched-chain amino acids (leucine, isoleucine, valine). The complete amino acid profile of aquatic proteins supports equivalent protein synthesis compared to terrestrial animal sources. Digestibility studies indicate fish protein absorption efficiency exceeding 95%, indicating substantial bioavailability across human populations.
Processing and Preservation Effects
Canning, smoking, and drying preserve fish protein while altering water and micronutrient content. Canned fish in water retains protein density while reducing sodium compared to oil-packed varieties. Smoke curing and drying concentrate protein per unit weight through water removal, though sodium content may increase substantially through processing methods. Freezing fish at harvest peaks nutritional content and preserves protein quality equivalent to fresh products.
Educational Context
This article presents nutritional data for informational purposes. Individual protein requirements and dietary suitability vary based on age, activity level, health status, and personal preference. Consult healthcare providers for guidance on dietary decisions.